Observability in Audius’ Decentralized System
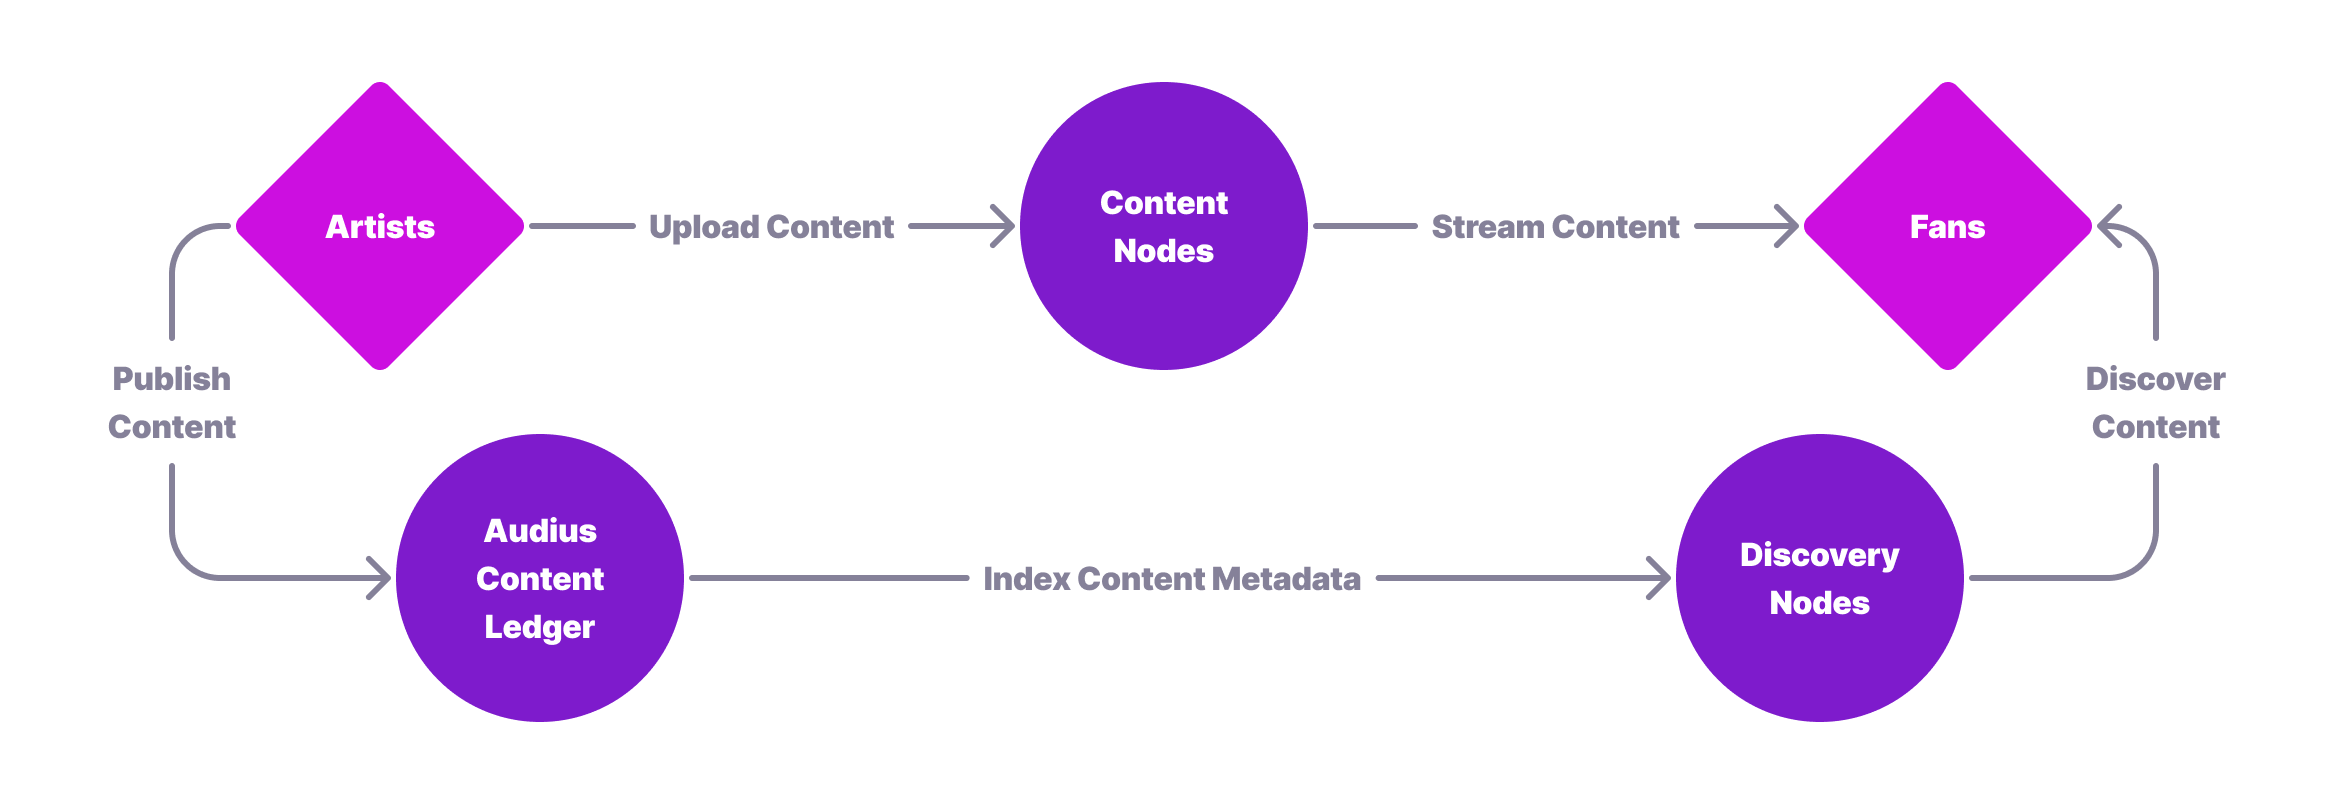
When developing software for decentralized systems, the bugs and errors that appear can be incredibly complex compared to traditional distributed systems. At Audius, the protocol not only has to deal with a decentralized blockchain, but also our decentralized discovery network (responsible for indexing), and decentralized content network (responsible for storing and serving content to users). For this reason, good observability is crucial at Audius.

We collect logs, trace data, and custom metrics from nodes to help our team troubleshoot and build better software. On top of this, our team has developed a custom tool called Network Monitor which compiles data from our discovery and content networks into a single, easy to extend database that provides in-depth knowledge about the health and status of Audius.

🌐 Monitoring Decentralized Networks
Understanding and figuring out what software is doing while it’s running, whether on a dev environment, in staging, or production, is a tough thing to get right. Fortunately, there are already plenty of enterprise-grade observability and analysis tools out there that make the task considerably easier. And while many of these tools provide a thorough set of observability into applications along with a rich feature-set for almost any use-case, at Audius, we have one requirement that disqualifies the vast majority of tools: it has to be able to be run by anyone in the community rather than just ourselves. Content nodes and discovery nodes are run by 3rd parties and the entire protocol is open source, so we can’t use something with an API key or something that forces 3rd party service providers to stream metrics to a centralized database. The one metrics tool that fits our use-case is Prometheus. By using Prometheus’s pull-based system, we can simply expose a public http route on nodes which anyone can scape (e.g. https://creatornode3.audius.co/prometheus_metrics). No API keys required and anyone running a node doesn’t have to worry about pushing metrics to a single, centralized destination.
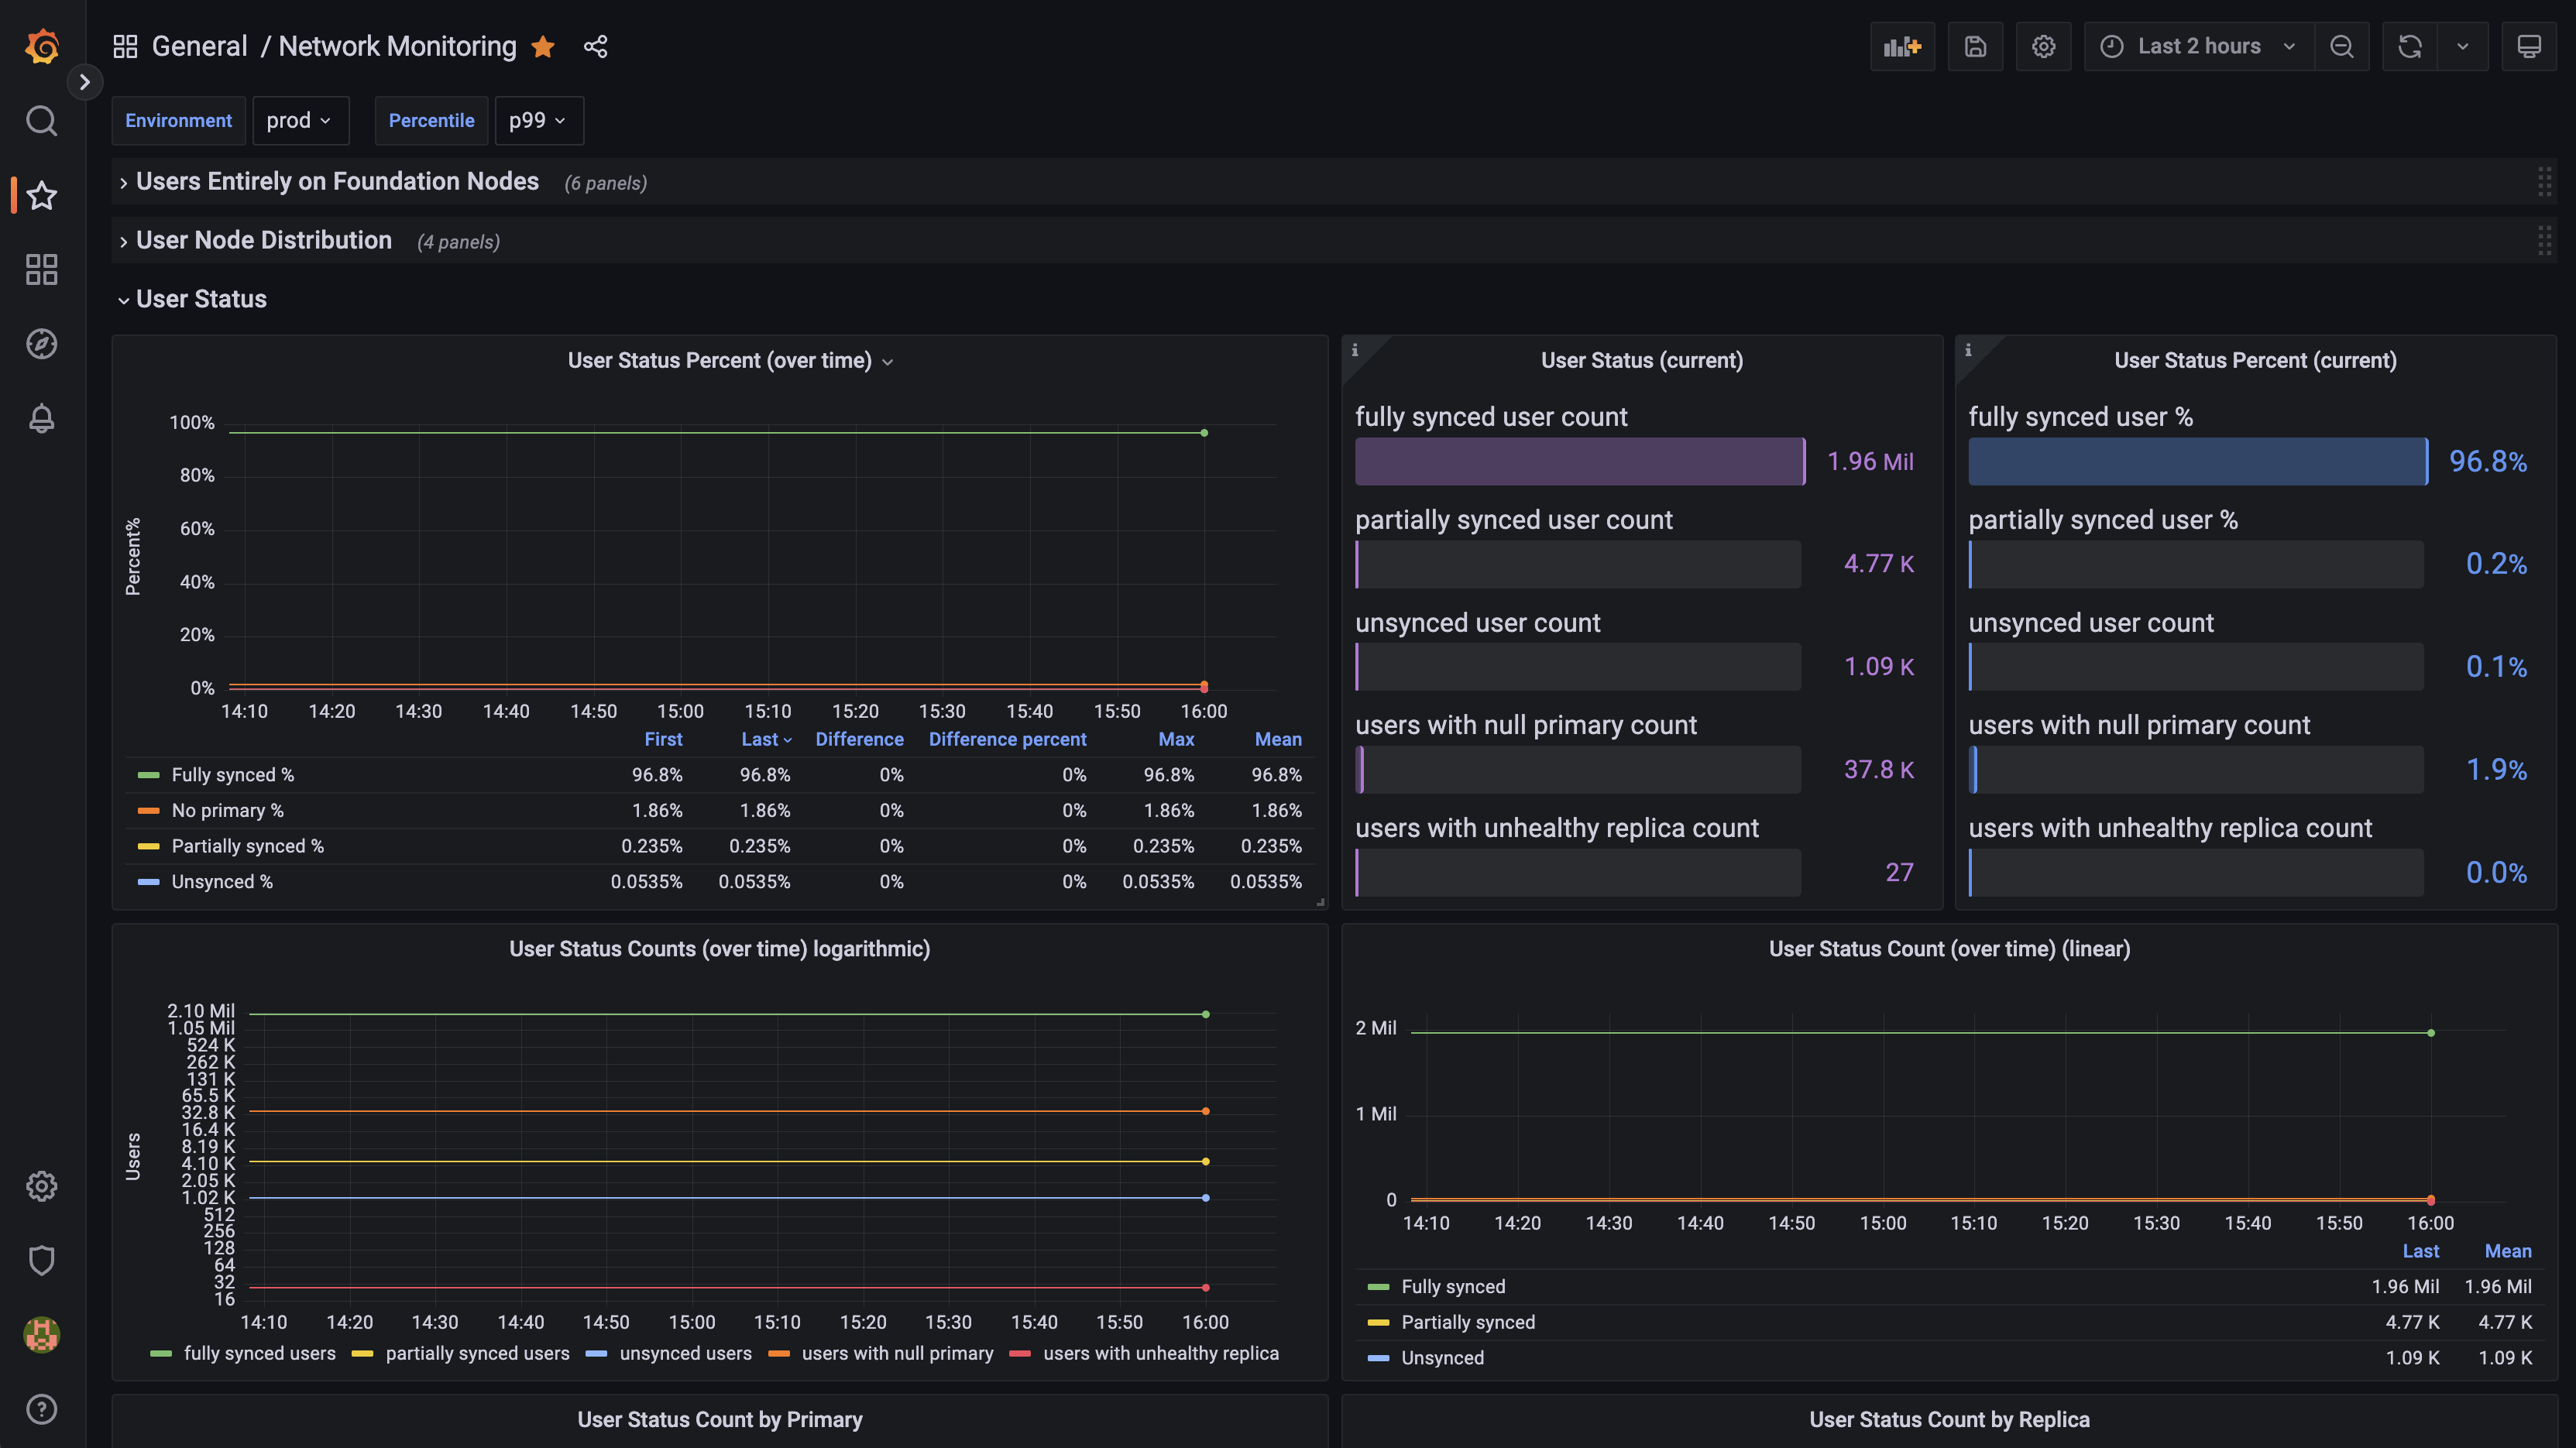
Prometheus does a great job at giving our team a look at how an individual content or discovery node is doing, but what about network wide metrics such as whether a specific user has a complete and healthy content node replica set? Or, even better, how many users in total have a complete and healthy content node replica set? Or, even even better, how many users in total have had a complete and healthy content node replica set over the last week? Metrics like this require making OLAP-style queries on information from multiple nodes. Generally, the industry standard for generating metrics like this would be through some kind of data warehouse which ingests data from production servers (in our case, that would be the database of a discovery node as well as the databases from all content nodes) but unfortunately, most of the data warehouse solutions (e.g. Big Query, Redshift, Snowflake, etc. ) are very centralized. Championing the spirit of decentralization, we wanted a solution that would give anyone the ability to independently collect this data and generate network-wide metrics so we built our Network Monitor tool. This runs alongside a discovery node and aggregates metrics about the network to be exposed using prometheus just like every other service. Our team runs a Network Monitoring instance that allows us to create dashboards like this.

🧩 Plugin Architecture

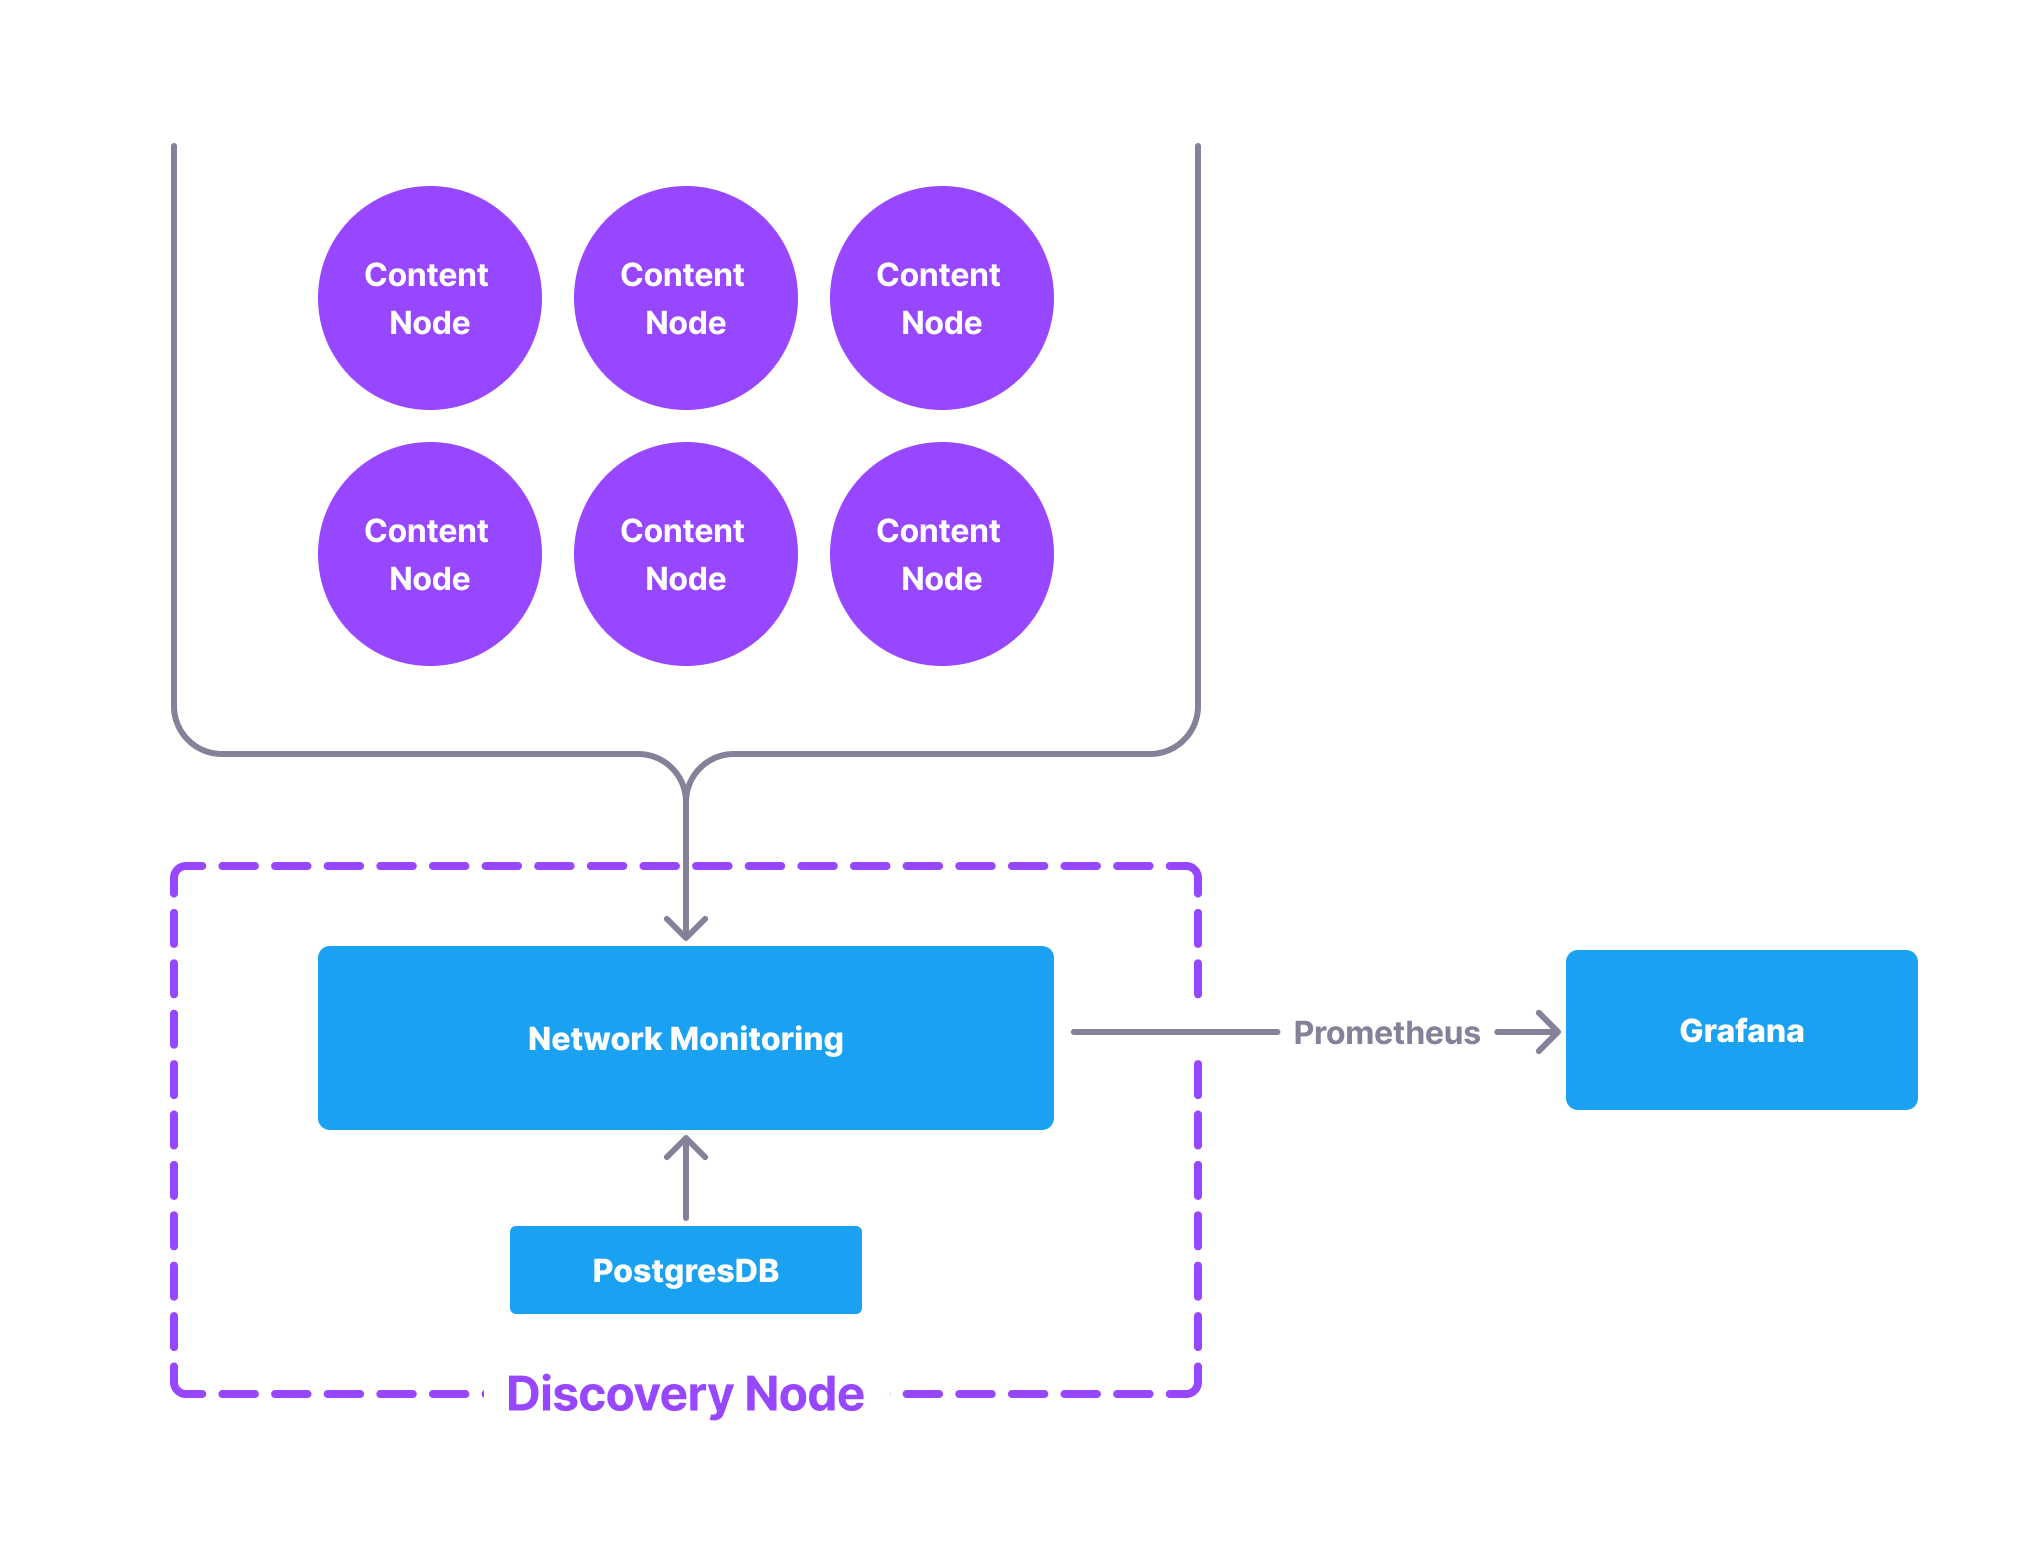
The Network Monitor is built as a plugin for Discovery Nodes and is currently the first and only plugin for them (with more to come). Understanding how plugins work requires a brief mention of how discovery nodes are deployed. Every service required to get a discovery node deployed on a machine (i.e. web server, db, redis, etc.) is run using Docker and orchestrated with Docker Compose (Discovery Node’s container definitions can be found here). So plugins, like Network Monitor, are just extra sidecar containers run on the node. For Network Monitoring in particular, the extra container is able to read directly from the Discovery Node’s Postgres database, make network requests to Content Nodes, and expose prometheus metrics via a lightweight web server.
For other developers interested in creating their own queries or metrics for Network Monitoring, the technical docs for running the plugin and what metrics it already collects can be found here and the actual SQL queries run for reference can be found here.
🎓 Learn More
Properly monitoring a system’s health and properly monitoring a decentralized system’s health is very hard but at Audius we’ve found a structure and method for monitoring and telemetry that has allowed our team to effectively understand and develop on the network. The combination of Prometheus for individual node metrics and aggregated metrics from our Network Monitor tool have proven extremely valuable and we’d love to see how other developers find use in them. Our entirely monitoring stack can be found in the protocol’s monorepo here and all documentation can be found at https://docs.audius.org (whose source code can also be found in our monorepo here - OSS FTW).
By the way, if you like this stuff (if you’ve made it this far you probably do) and want to come work with us, we’re hiring! Check out our open positions here.
